Submitted by QTR's Fringe Finance
Friend of Fringe Finance Lawrence Lepard released his most recent investor letter this week. He gets little coverage in the mainstream media, which, in my opinion, makes him someone worth listening to twice as closely.
Larry was kind enough to allow me to share his thoughts heading into Q3 2024. The letter has been edited ever-so-slightly for formatting, grammar and visuals.
This is Part 1 of his letter, part two will be published later this week.
QUARTERLY OVERVIEW
In the second quarter ended June 30, the most notable development was that silver performed very well and followed the Q1 break-out in gold. Recall, in early March gold broke through the 3-year resistance ceiling at $2,070/oz. and subsequently shot as high as $2,400 before backing off to the $2,375 area presently. In the case of silver, the ceiling was in the $26 -- $27/oz area, and in early April silver broke through this and subsequently traded up to $32 before settling at $30-$31/oz area presently.
This is important because, historically, silver tends to lag gold, but when silver gets going it moves much higher and much faster. The silver break-out confirms gold’s break-out and historically a falling gold to silver ratio is a part of all precious metals bull markets.
Another interesting development in the quarter was the S&P 500. After a rocky April, where the S&P 500 index was down -4.1%, the stock market came storming back in May and June and hit a new record high on June 29, leaving the stock market up + 15.3% in the 1H 2024. Nothing seems to slow this stock market down and it is now up +81% since January 1, 2020. Investors seem convinced that stocks are invincible and the winning strategy since 2008 has been to buy the dip. Given record valuations and higher interest rates that are just beginning to have an impact on consumption, we believe there is vulnerability there, even though we would not short it. (meaning it is probably ready to break).
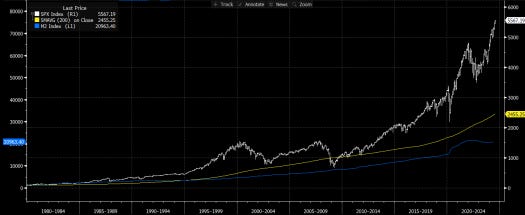
The next chart is incredible. It depicts the “everything bubble” driven by fiat money creation.
Note the S&P 500 (white line) and how it’s so FAR ABOVE its 200 Day Moving Average (yellow line)
In both 2000 and 2008, the S&P 500 corrected back to its 200 day moving average
That would be a 55% crash if that happened now
Also note the M2 Money Supply (blue line), which has blown this everything bubble for the past 15 years. o M2 has increasingly had to do more heavy lifting over the past four years
That’s what happens in a levered economy – you need to print more to keep the game going
S&P 500 Index / 200 Day Moving Avg vs. M2 Money Supply: 1980-Present
What makes this bubble particularly risky is that it exists at the sovereign debt/currency level. Not simply dotcoms or houses. Historically, parabolic moves like the one above have not ended well. But who are we to say when it will end. When it does end, no amount of monetary accommodation is going to save it, and the amount of M2 growth necessary just to keep the system functioning is going to be substantial.
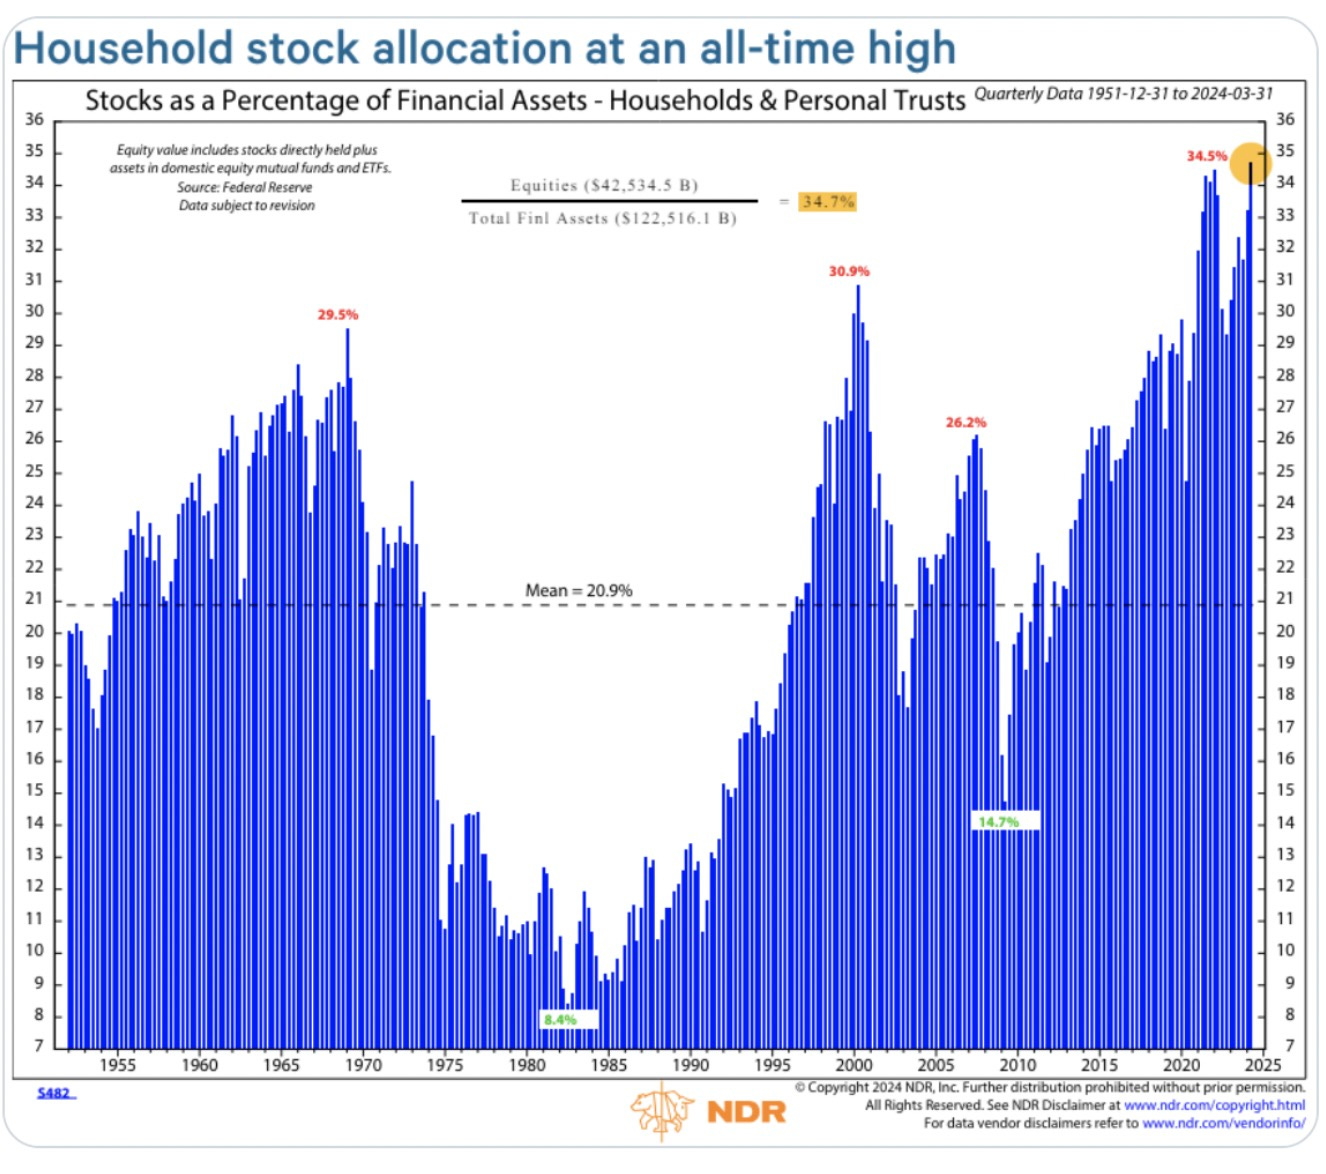
The chart below shows another view of this bubble. People sure do love their stocks with stocks comprising approximately 35% of household’s overall assets. Historically, peaks like this have led to rather large future drawdowns. Most particularly in the inflationary decade of the 1970’s, a period that we believe shares the same characteristics as the one we are now entering.
The reason we are focusing on the US stock market is that it is sucking all of the air out of the room for gold and silver mining stocks. People chase performance and so we need gold and silver shares to outperform the broader markets on a consistent basis and then more people will pay attention to them.
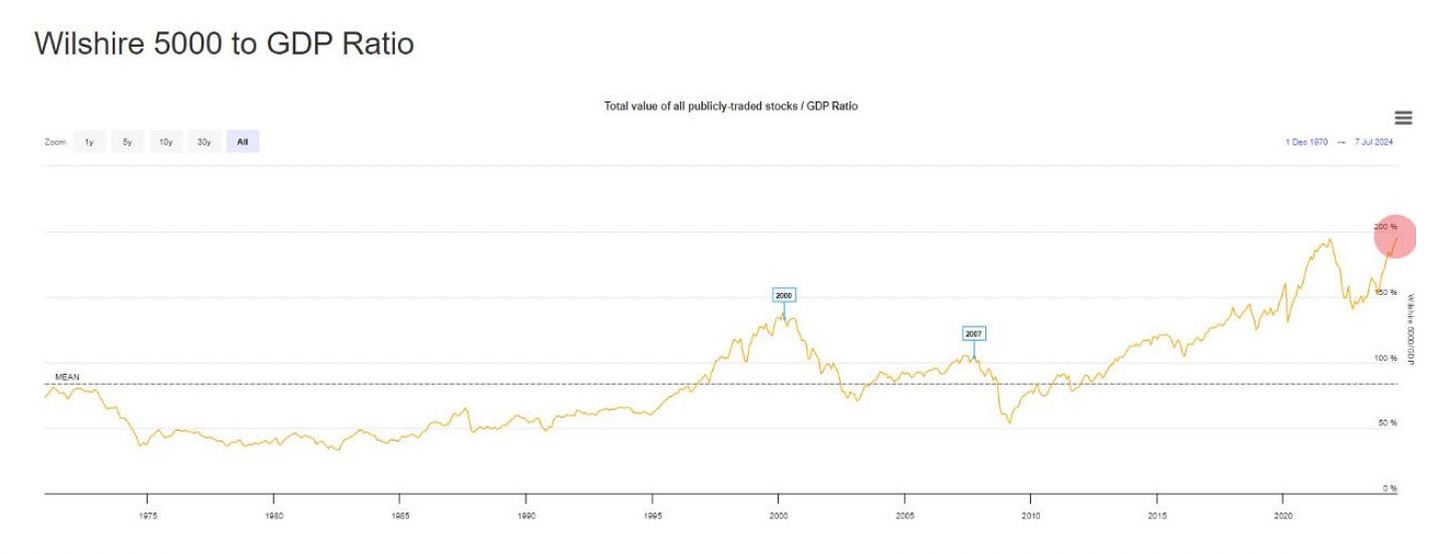
Warren Buffett’s favorite dashboard item, the Total Stock Market value / GDP Ratio shows we are back to the 2021 all-time high.
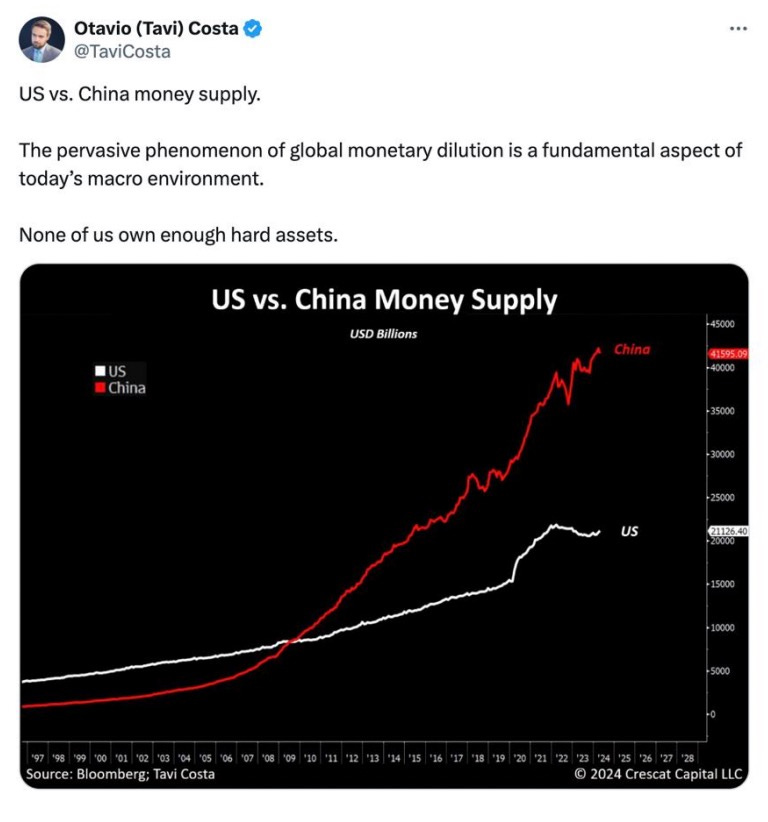
The schedule below shows how the growth in fiat currency is not just a US phenomenon. China has outpaced the US in creating fiat currency. This surely has had an impact on prices of all assets worldwide.
MACRO ECONOMIC DEVELOPMENTS
So, the US stock market is priced for economic perfection. Will we attain it? It’s a cloudy picture.
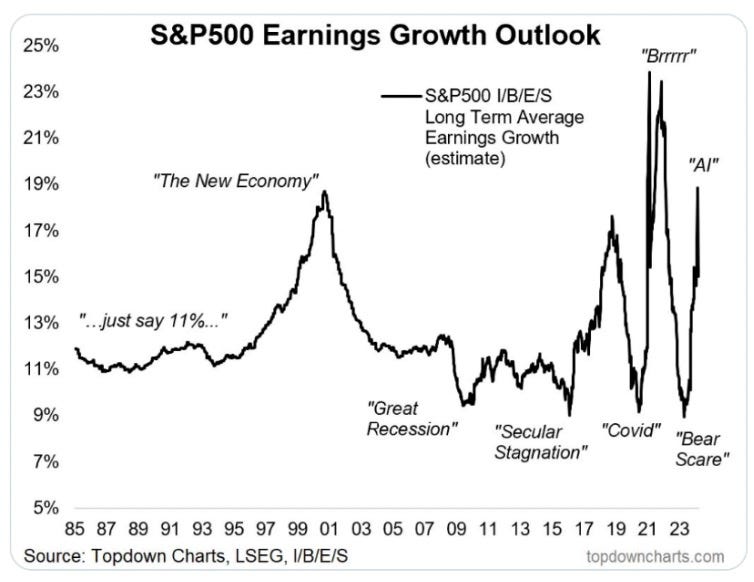
The bull case for stocks includes: (i) money supply growth globally is beginning to occur again; (ii) fiscal stimulus has outweighed monetary restraints; and (iii) Wall Street is projecting continued earnings and revenue growth.
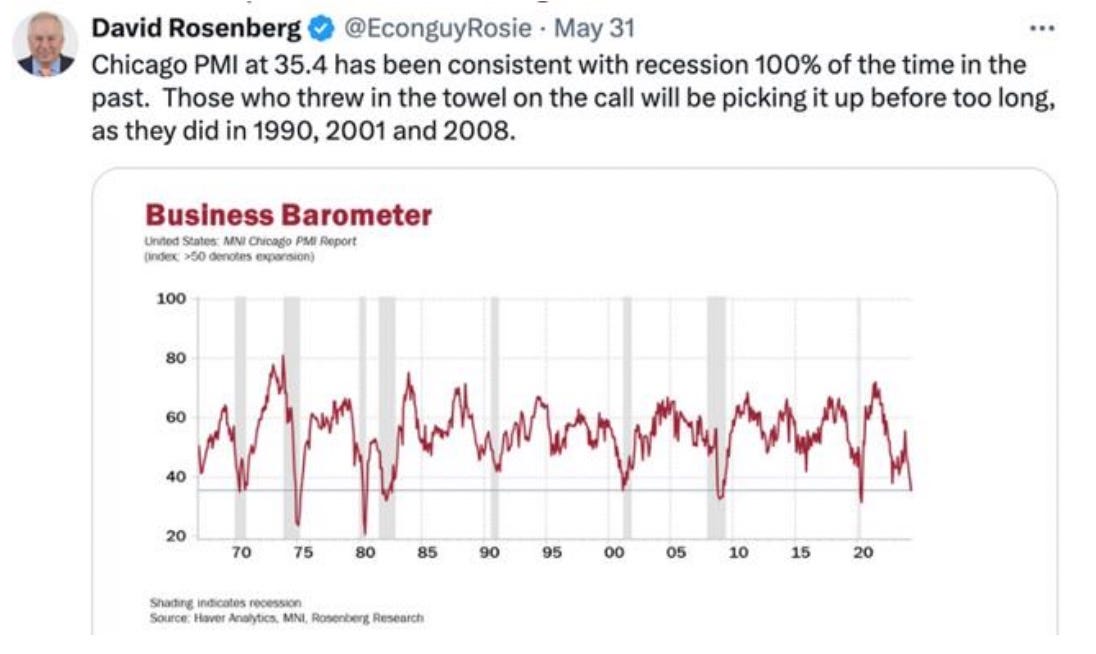
The bear case for stocks includes: (i) the historical valuation and technical extremes outlined above; and (ii) various concerning early warning economic signals. Below are four important charts on that front.
1. PMI Declining - the Chicago PMI is warning of an imminent downturn
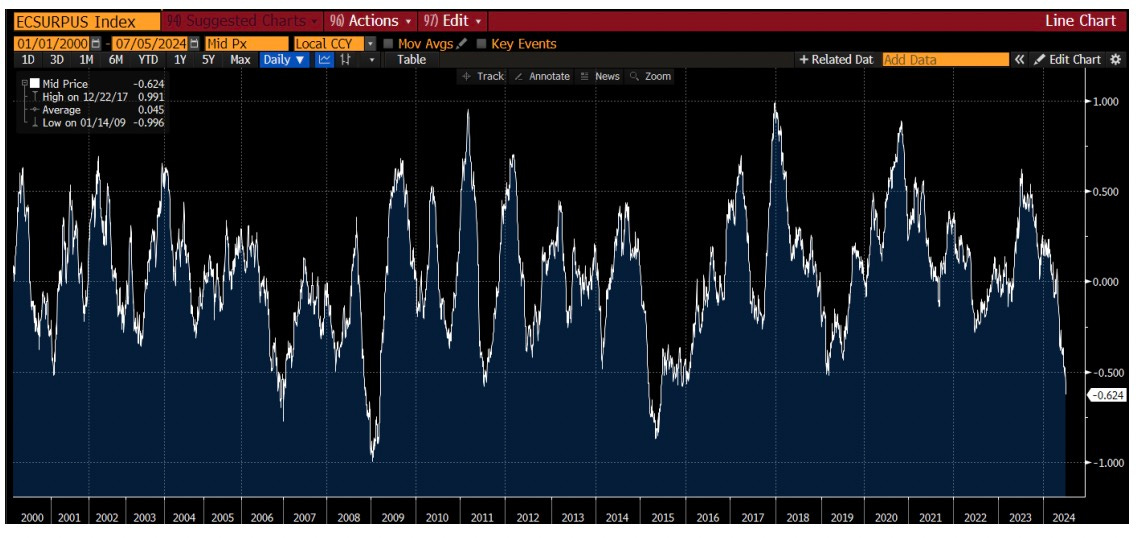
2. Bloomberg US Economic Surprise Index has turned very negative and is approaching ominous levels. Will it matter? We believe that it could.
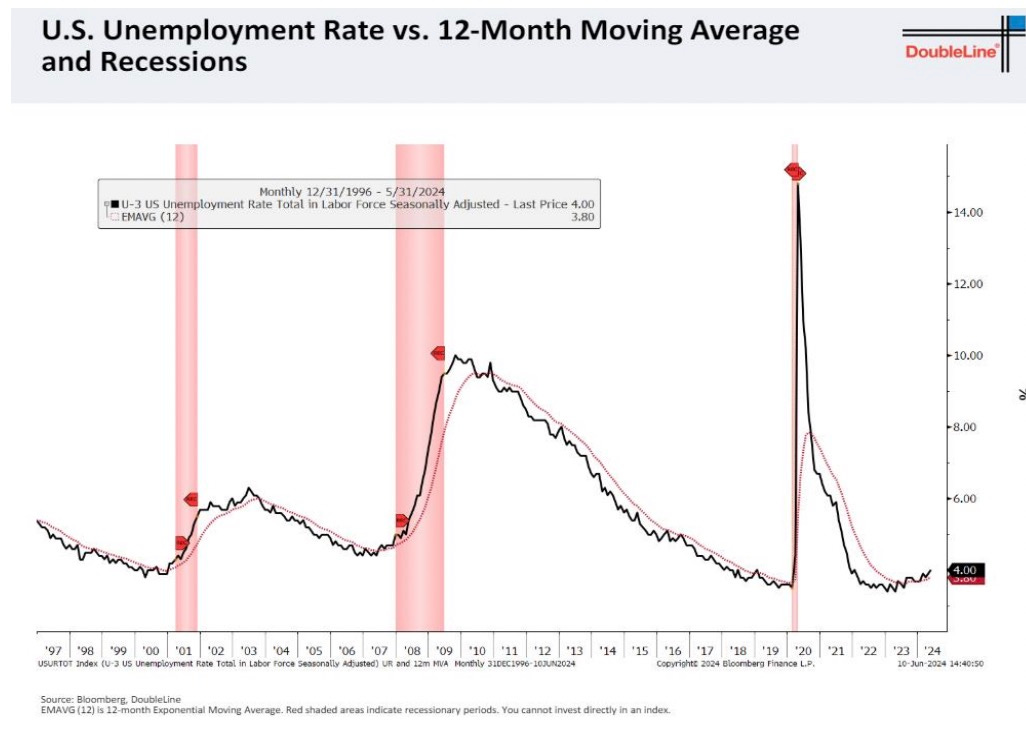
 3. Unemployment - Jeff Gundlach of DoubleLine has harped on unemployment as being the next grenade to set off market alarms. As you can see below, it is starting to increase – in fact, the June unemployment rate came in above expectations at 4.1%. Notice how similar patterns in unemployment in 2000, 2007 led to serious problems. Again, no guarantees but worth watching
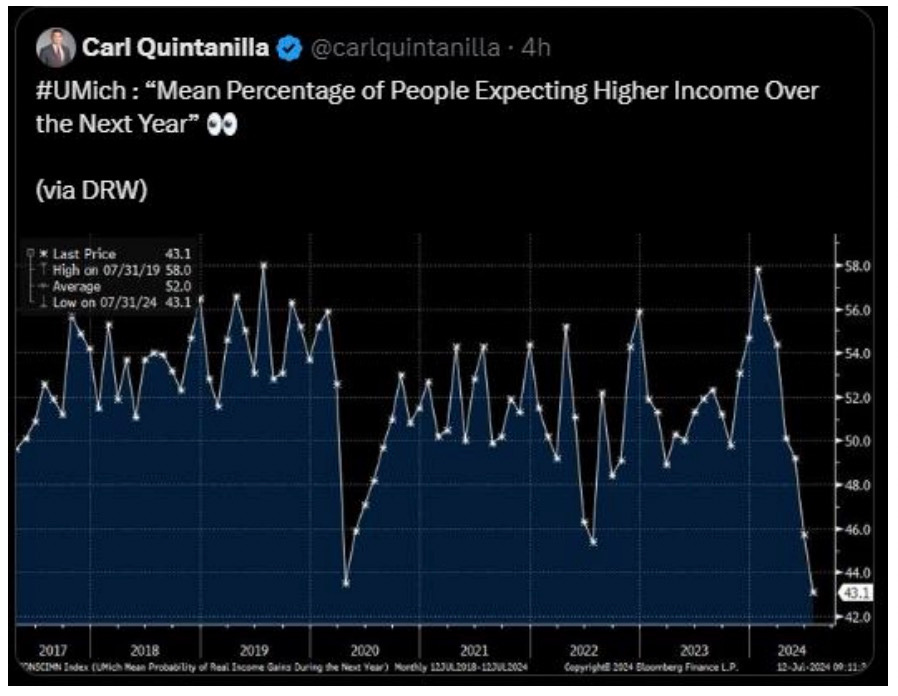
4. Consumer Confidence - The fourth and final bear market risk data point deals with consumer confidence, which is slipping.
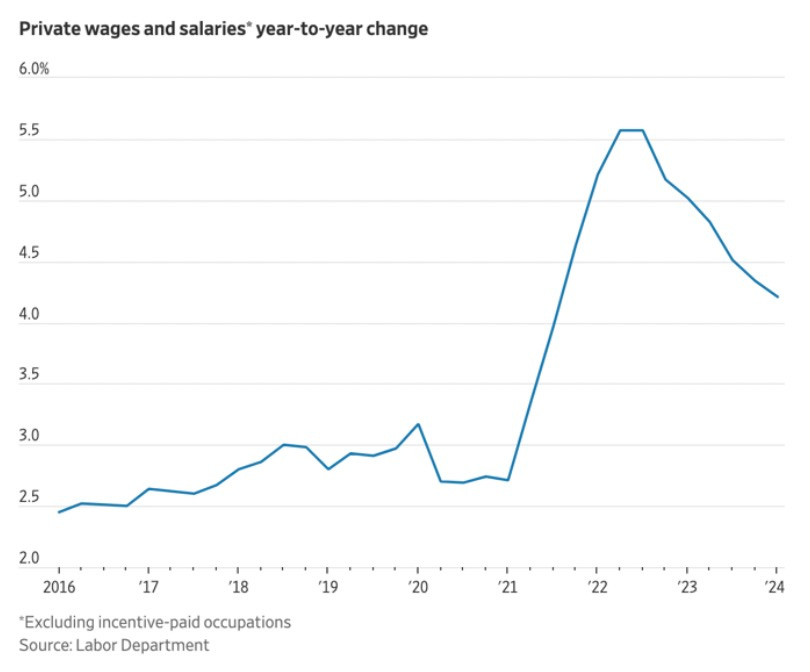
Turning to inflation, CPI has certainly decelerated from the 2022 high of 9.1%, with the June 2024 CPI print coming in at 3.0%. The Fed has a stated inflation target of 2% but it will be hard to get there if private wages and salaries continue to grow at a greater than 4% rate as seen in the chart below.
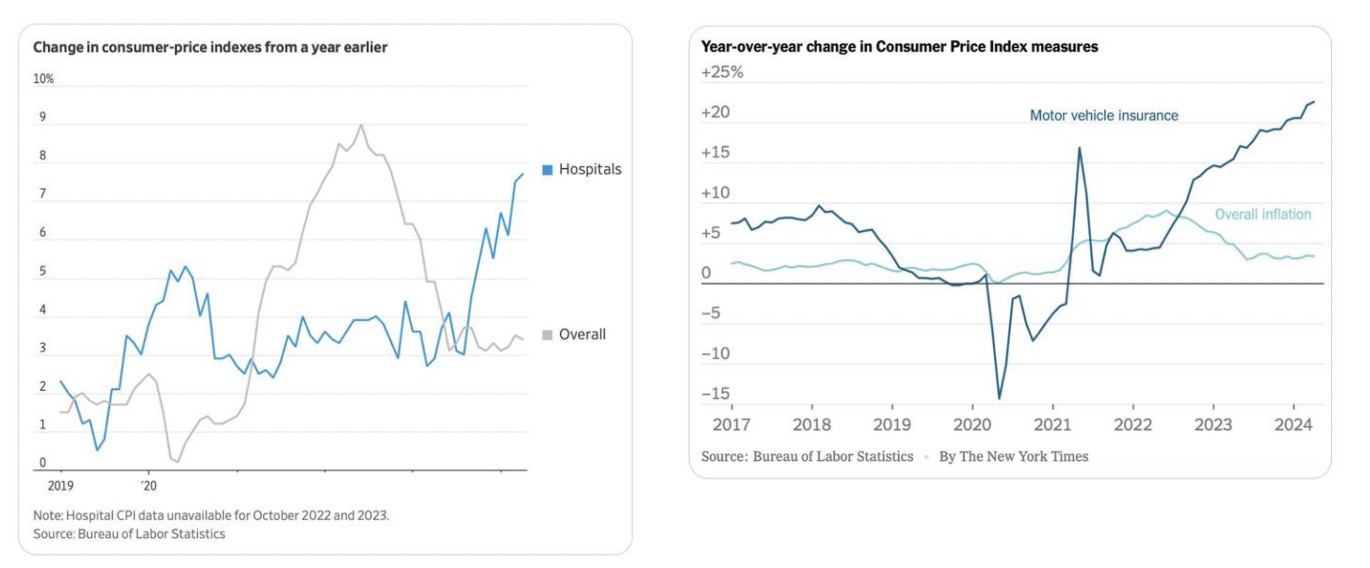
Furthermore, even though the BLS shows inflation in the mid 3% range, some segments are much hotter:
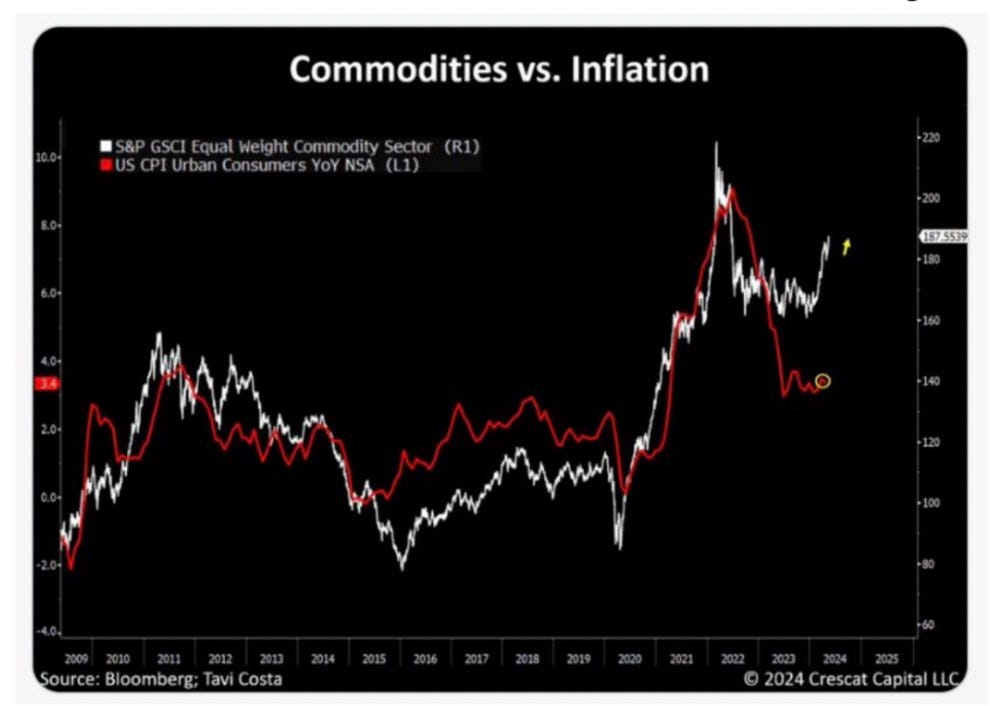
If inflation does not decelerate further, it will be difficult for the Fed to cut rates which would have very negative implications for the interest cost on the outstanding US Federal debt. Furthermore, as the next schedule shows, inflation is fairly tightly correlated with commodities prices. The white line in the next chart is the S&P Goldman Sachs equal weighted commodity index and the red line is the all consumer CPI inflation reading. Note how they both made huge moves upward when the Fed grew the money supply by over 40% in 2020-2021 to address the COVID crisis. Also note how they have fallen as the Fed has demonstrated monetary restraint (higher interest rates and QT). Then finally note how the commodity index has started to move north again. We believe inflation will follow. As we have said in prior reports we believe this decade will look a lot like the 1970’s with recurring waves of inflation.
The problem with inflation is that it leads to higher bond yields and lower stock prices. Both of these things will only further damage the already fragile US Federal Government fiscal situation. If we get inflation combined with slower growth or a downturn (recession) then we have the dreaded “stagflation” which was the dominant theme of the 1970’s.
🔥 50% OFF FOR LIFE: Zero Hedge readers take 50% off a Fringe Finance annual subscription for life by using this link: ZH50
THE ELECTION, SPECIAL INTERESTS AND DEBT
Like so many Americans, we too are frustrated and upset by what we are witnessing. From the horrific assassination attempt on Trump….to watching President Biden’s debate performance that makes it apparent that certain media outlets and the DNC itself have had an agenda to obfuscate the truth. It’s as if certain “elites” think that “we the people” are dummies and can be fooled. And to be clear – it’s both parties that are duping ALL Americans. Real Marie Antoinette / 1789 French Revolution type stuff.
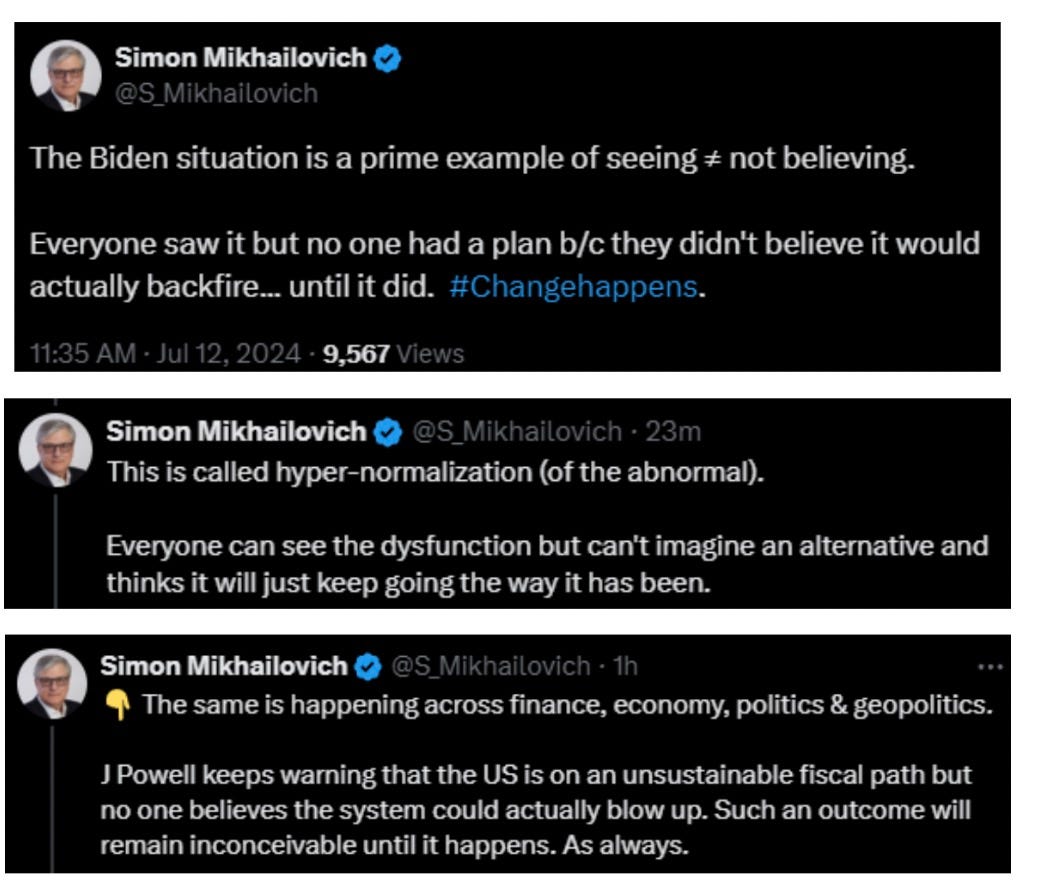
As The Bullion Reserve’s Simon Mikhailovich points out:
We’ve always disliked the term “the Deep State” as it doesn’t do justice to how our political system has led us to this breaking point. If you say that term, most folks roll their eyes and think you are a conspiratorial nut. But so much of it adds up. Deep State should be called “special interests”. It’s simply how our government works and is so far afield from what our Founding Fathers wanted.
The Lobbyists pay the politicians the money to advocate a War agenda for the benefit of the Military Industrial Complex or to raise tariffs for certain commodity or technology industries. This has gone on for a long time. And it’s not just a US problem. It has now led to 50 years of wasteful spending and debt buildup, and you can’t put the debt genie back in the bottle and de-lever. It would kill the economy. Politicians just focus on the next election and vote for what the “special interest” lobbyists want….and the negative cycle continues and continues, until something eventually will break.
• For more on this topic, we encourage you to listen to even just the first 30 mins of this Tucker Carlson interview of Jeffrey Sachs from June 2024.
• Also, just so you don’t think we are “crazy conspiracists”, search “Operation Northwoods” on Wiki and you’ll get an example from 1962 of this type of stuff via all those unsealed documents.
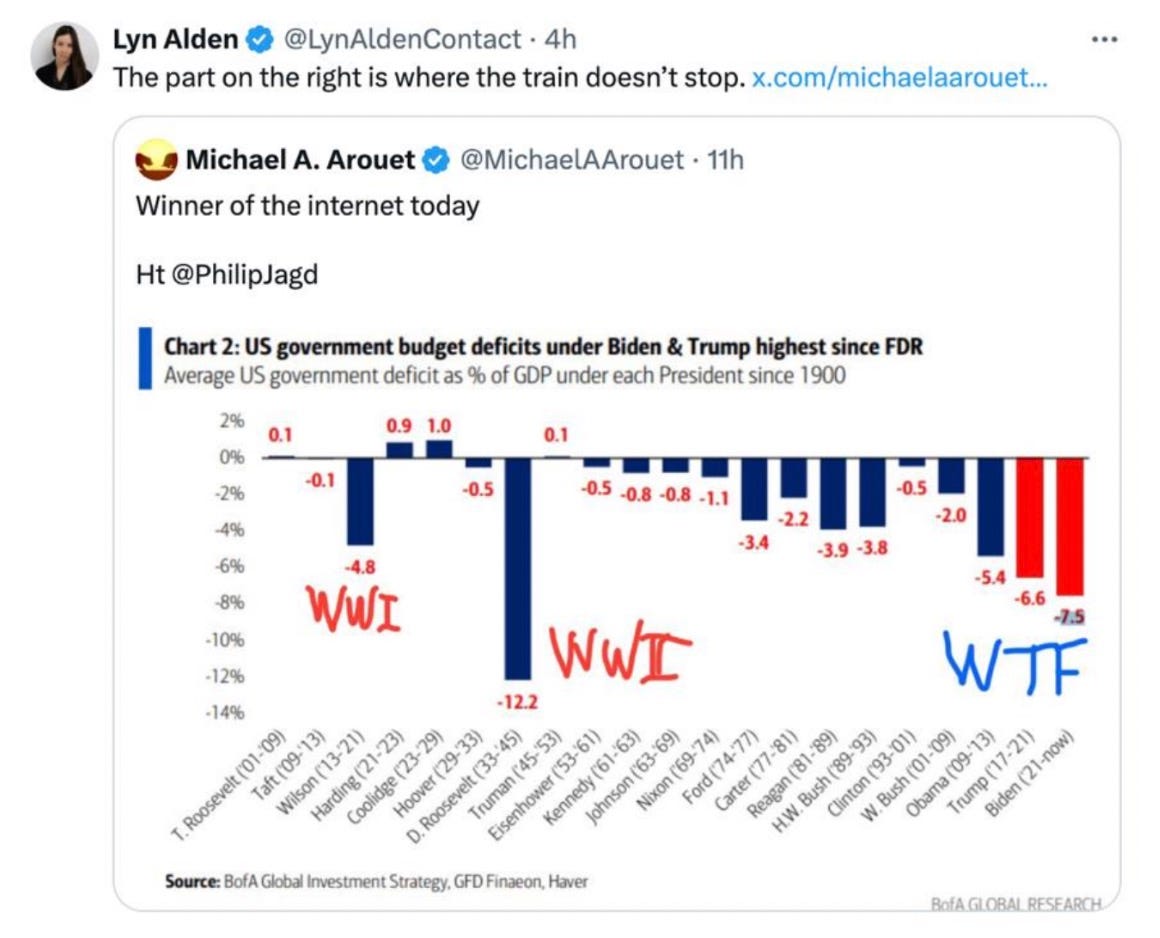
Regardless of which administration wins the election, Washington likes to spend. Particularly given that (i) both Trump and Biden will only have 1 final term left, so budgets don’t matter; and (ii) the debt problem / interest rates / inflation rates cannot be easily resolved.
Lyn and Michael’s Tweet does a nice job of showing the problem:
You can read part two of this letter here. It includes:
Federal Government Finances are a Mess
The US Bond Market is Sick
BRICS and Dedollarization
Gold Demand
Gold Supply Remains Constrained
Gold and Silver Stocks Are Silly Cheap
QTR’s Disclaimer: Please read my full legal disclaimer on my About page here. This post represents my opinions only. In addition, please understand I am an idiot and often get things wrong and lose money. I may own or transact in any names mentioned in this piece at any time without warning. Contributor posts and aggregated posts have been hand selected by me, have not been fact checked and are the opinions of their authors. They are either submitted to QTR by their author, reprinted under a Creative Commons license with my best effort to uphold what the license asks, or with the permission of the author. This is not a recommendation to buy or sell any stocks or securities, just my opinions. I often lose money on positions I trade/invest in. I may add any name mentioned in this article and sell any name mentioned in this piece at any time, without further warning. None of this is a solicitation to buy or sell securities. These positions can change immediately as soon as I publish this, with or without notice. You are on your own. Do not make decisions based on my blog. I exist on the fringe. The publisher does not guarantee the accuracy or completeness of the information provided in this page. These are not the opinions of any of my employers, partners, or associates. I did my best to be honest about my disclosures but can’t guarantee I am right; I write these posts after a couple beers sometimes. I edit after my posts are published because I’m impatient and lazy, so if you see a typo, check back in a half hour. Also, I just straight up get shit wrong a lot. I mention it twice because it’s that important.
Source link


