Traffic congestion costs drivers around the world hours of lost time and economic productivity.
Traffic can serve as an economic indicator, as the flow of people, goods, and services drives the demand for road travel, reflecting underlying economic activity. But when this demand surpasses the available road capacity, it leads to congestion, time lost in traffic, and often rising frustration.
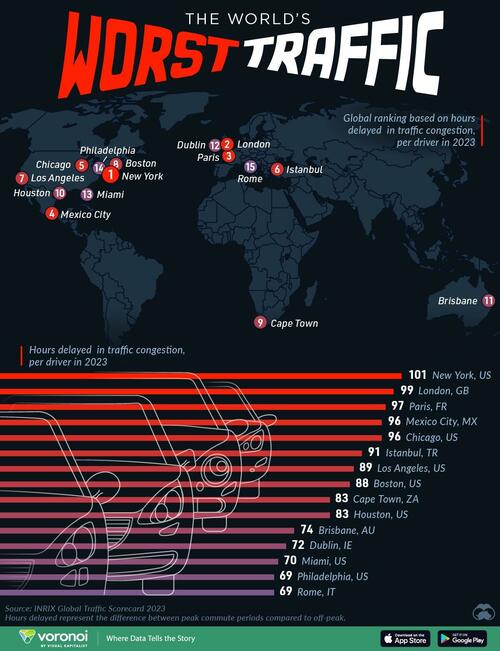
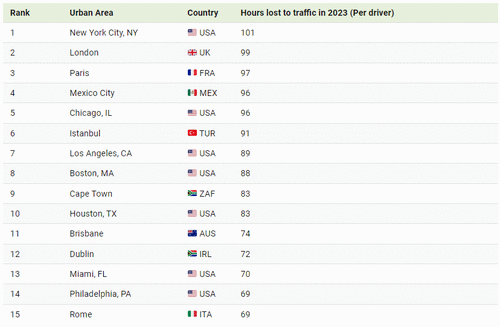
This chart, via Visual Capitalist's Kayla Zhu, shows the 15 worst cities around the world for traffic congestion in 2023, ranked by the average number of hours lost to traffic congestion per driver when driving during peak commute hours compared to driving during off-peak hours in 2023.
Data comes from the INRIX Global Traffic Scorecard 2023.
Which Cities Have The Worst Traffic?
Below, we show the 15 cities around the world with the worst rush hour traffic, as measured by hours lost to traffic congestion during peak commute hours in 2023.
In 2023, drivers in New York had it the worst. On average, drivers in The Big Apple lost 101 hours to traffic jams in 2023, costing more than $1,700 in lost time and productivity. In the U.S., traffic delays cost the typical driver more than $733 in lost time, or $70 billion nationwide in 2023 according to INRIX.
Most of the cities struggling with the worst traffic congestion are some of their respective countries’ largest economic hubs including: New York, London, Paris, Mexico City, Rome, Istanbul, and Cape Town.
These economic centers are characterized by large populations, a high density of businesses, and significant daily commuter traffic.
In 2003, the city of London introduced the Congestion Charge, which charges cars being driven within the Congestion Charge Zone in central London during specific hours £15 a day. Drivers who don’t pay the Congestion Charge are fined £160.
Last year the city of London shared the results of the Congestion Charge, with the city’s traffic congestion having fallen by 30% while boosting public transport use along with walking and cycling.
To see which cities in the U.S. had it the worst, check out this graphic that visualizes the 15 U.S. cities with the worst rush hour traffic.
Source link


