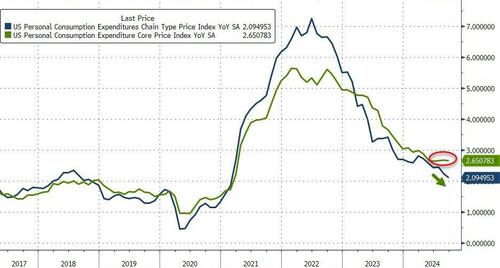
The Fed's favorite inflation indicator - Core PCE - printed hotter than expected in September (+2.7% vs +2.6% exp), flat with August's 2.7% rise...
Source: Bloomberg
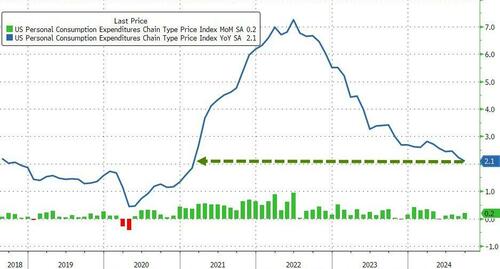
The headline PCE rose 0.2% MoM, which dragged down YoY PCE to +2.1% - its lowest since Feb 2021...
Source: Bloomberg
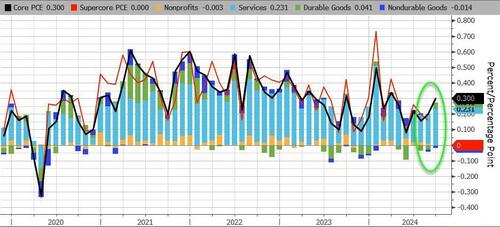
On a MoM basis, PCE appears to be accelerating with Durable Goods and Services costs picking up...
Source: Bloomberg
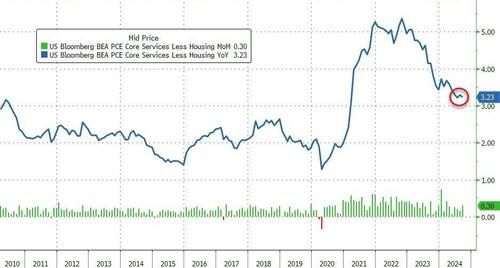
And finally, the so-called SuperCore PCE (Services Ex-Shelter) rose 0.3% MoM leaving the YoY cange 'sticky' at around 3.2%...
Source: Bloomberg
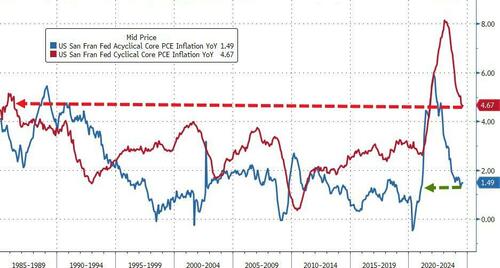
Of significant note is the fact that cyclical inflation is awkwardly stuck extremely high while the cyclical segment of inflation has reverted to normal...
Source: Bloomberg
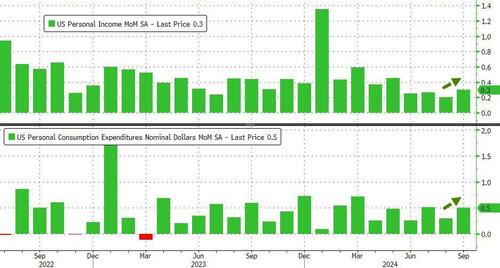
Personal Incomes rose 0.3% MoM (as expected) but Spending rose by more (+0.5% vs 0.4% exp)...
Source: Bloomberg
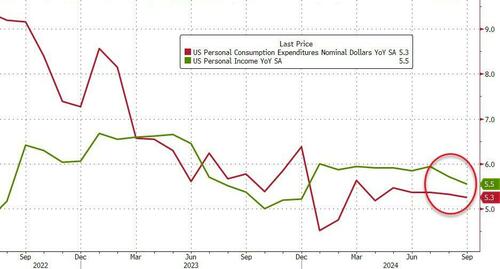
But on a YoY basis, bond spending and income growth is slowing...
Source: Bloomberg
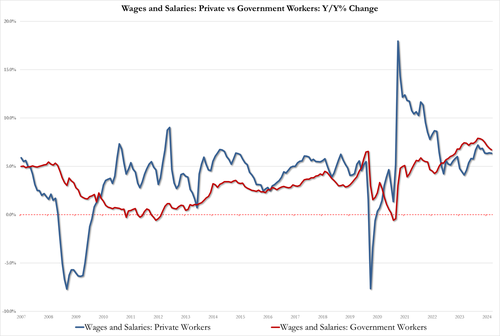
On the income side, Private wage growth 6.4% in Sept, unch while Government wage growth 6.7% in Sept, down from 6.9%, and well below record high 7.9% in March...
Source: Bloomberg
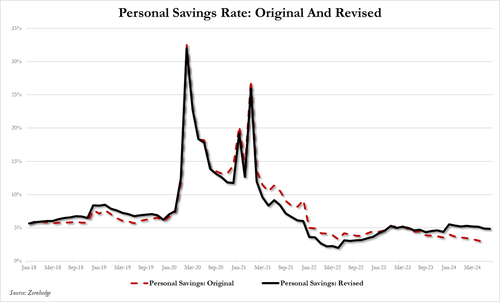
Overall, the savings rate declined. BUT, as is clear from out chart below, this new "revised higher" savings rate (that magicall creasted so much more wealth for Americans) is starting to fade fast (another revision needed?)...
Source: Bloomberg
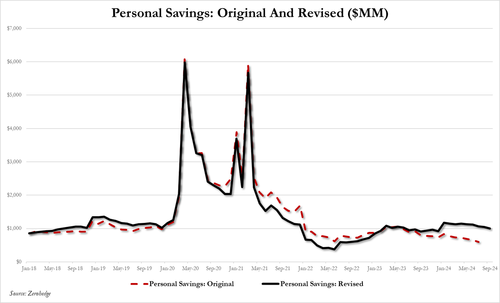
...which means personal savings tumbled by $49 Billion in September to $1.00 trillion...
Source: Bloomberg
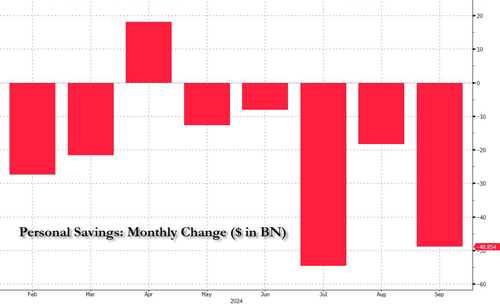
That's the 7th month of the last 8 that Americans have drained their savings (down $173BN since January)...
Source: Bloomberg
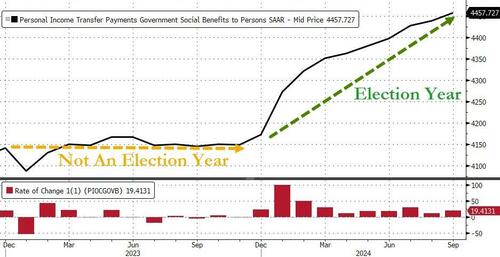
And finally, imagine how bad things would be if the government wasn't having over billions to 'we, the people' all of a sudden...
Source: Bloomberg
Not exactly the kind of data that enshrines The Fed with a god-given right to cut rates.
Source link


