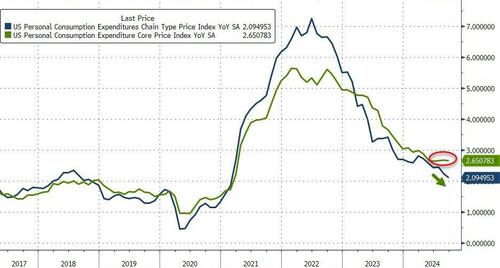
The Fed's favorite inflation indicator - Core PCE - printed hotter than expected in September (+2.7% vs +2.6% exp), flat with August's 2.7% rise...
Source: Bloomberg
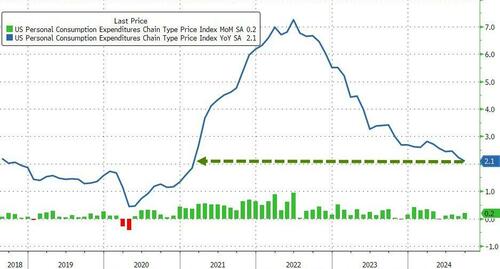
The headline PCE rose 0.2% MoM, which dragged down YoY PCE to +2.1% - its lowest since Feb 2021...
Source: Bloomberg
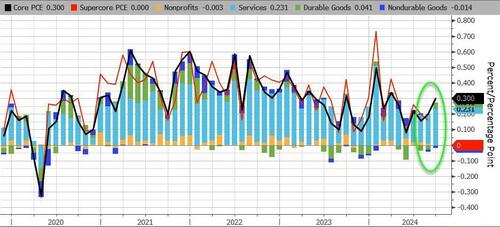
On a MoM basis, PCE appears to be accelerating with Durable Goods and Services costs picking up...
Source: Bloomberg
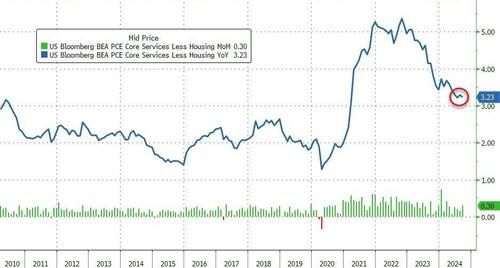
And finally, the so-called SuperCore PCE (Services Ex-Shelter) rose 0.3% MoM leaving the YoY cange 'sticky' at around 3.2%...
Source: Bloomberg
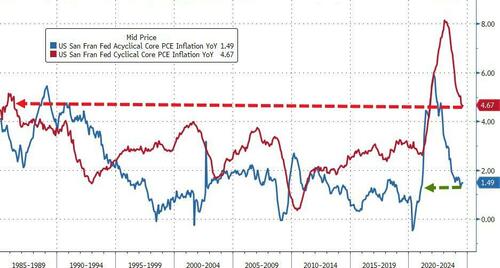
Of significant note is the fact that cyclical inflation is awkwardly stuck extremely high while the cyclical segment of inflation has reverted to normal...
Source: Bloomberg
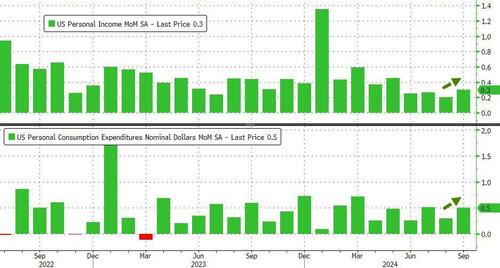
Personal Incomes rose 0.3% MoM (as expected) but Spending rose by more (+0.5% vs 0.4% exp)...
Source: Bloomberg
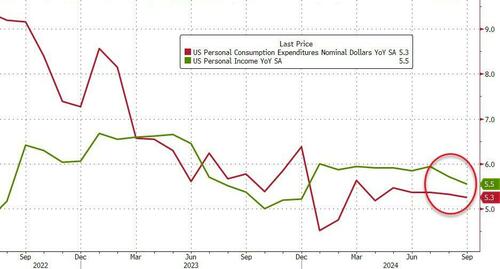
But on a YoY basis, bond spending and income growth is slowing...
Source: Bloomberg
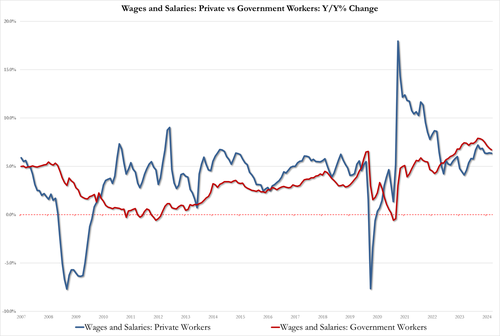
On the income side, Private wage growth 6.4% in Sept, unch while Government wage growth 6.7% in Sept, down from 6.9%, and well below record high 7.9% in March...
Source: Bloomberg
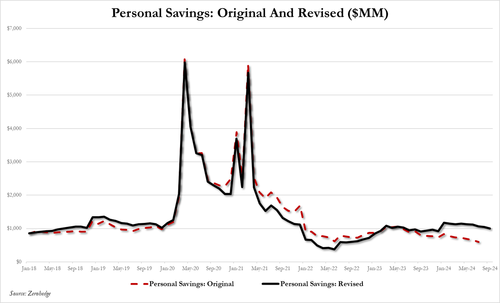
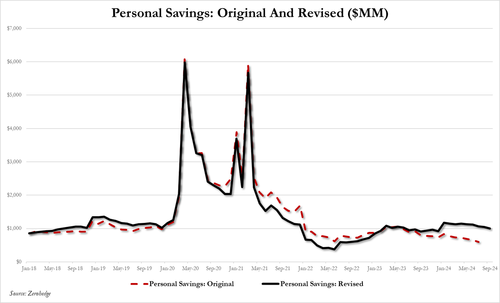
Overall, the savings rate declined. BUT, as is clear from out chart below, this 'higher' savings rate is a nonsense-ly revised higher level...
Source: Bloomberg
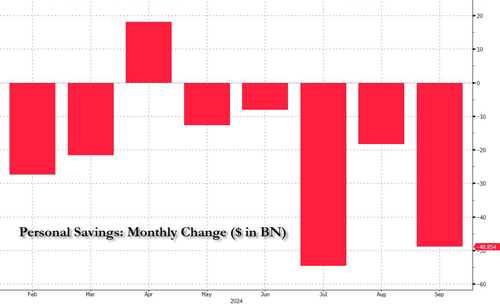
...which means personal savings tumbled by $49 Billion in September to $1.00 trillion...
Source: Bloomberg
That's the 7th month of the last 8 that Americans have drained their savings (down $173BN since January)...
Source: Bloomberg
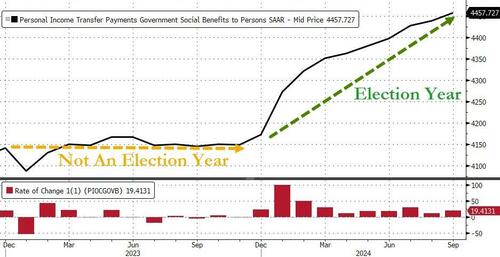
And finally, imagine how bad things would be if the government wasn't having over billions to 'we, the people' all of a sudden...
Source: Bloomberg
Not exactly the kind of data that enshrines The Fed with a god-given right to cut rates.
Source link


